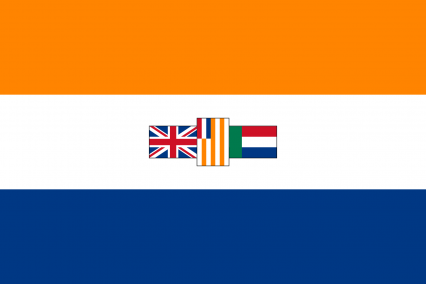
The Republic of White South Africa
Ex Unitate Vires
Region: Anglosphere
Quicksearch Query: White South Africa
|
Quicksearch: | |
NS Economy Mobile Home |
Regions Search |
White South Africa NS Page |
|
| GDP Leaders | Export Leaders | Interesting Places BIG Populations | Most Worked | | Militaristic States | Police States | |

Ex Unitate Vires
Region: Anglosphere
Quicksearch Query: White South Africa
| White South Africa Domestic Statistics | |||
|---|---|---|---|
| Government Category: | Republic | ||
| Government Priority: | Administration | ||
| Economic Rating: | Frightening | ||
| Civil Rights Rating: | Unheard Of | ||
| Political Freedoms: | Few | ||
| Income Tax Rate: | 46% | ||
| Consumer Confidence Rate: | 96% | ||
| Worker Enthusiasm Rate: | 97% | ||
| Major Industry: | Retail | ||
| National Animal: | Springbok | ||
| White South Africa Demographics | |||
| Total Population: | 1,035,000,000 | ||
| Criminals: | 84,606,238 | ||
| Elderly, Disabled, & Retirees: | 115,669,460 | ||
| Military & Reserves: ? | 35,798,868 | ||
| Students and Youth: | 198,927,000 | ||
| Unemployed but Able: | 138,590,804 | ||
| Working Class: | 461,407,629 | ||
| White South Africa Government Budget Details | |||
| Government Budget: | $18,040,954,164,955.05 | ||
| Government Expenditures: | $16,597,677,831,758.65 | ||
| Goverment Waste: | $1,443,276,333,196.40 | ||
| Goverment Efficiency: | 92% | ||
| White South Africa Government Spending Breakdown: | |||
| Administration: | $2,821,605,231,398.97 | 17% | |
| Social Welfare: | $2,655,628,453,081.38 | 16% | |
| Healthcare: | $1,493,791,004,858.28 | 9% | |
| Education: | $2,323,674,896,446.21 | 14% | |
| Religion & Spirituality: | $0.00 | 0% | |
| Defense: | $1,991,721,339,811.04 | 12% | |
| Law & Order: | $1,327,814,226,540.69 | 8% | |
| Commerce: | $2,655,628,453,081.38 | 16% | |
| Public Transport: | $663,907,113,270.35 | 4% | |
| The Environment: | $663,907,113,270.35 | 4% | |
| Social Equality: | $497,930,334,952.76 | 3% | |
| White South AfricaWhite Market Economic Statistics ? | |||
| Gross Domestic Product: | $13,404,200,000,000.00 | ||
| GDP Per Capita: | $12,950.92 | ||
| Average Salary Per Employee: | $17,583.79 | ||
| Unemployment Rate: | 14.22% | ||
| Consumption: | $18,249,471,271,895.04 | ||
| Exports: | $4,453,293,694,976.00 | ||
| Imports: | $4,537,556,926,464.00 | ||
| Trade Net: | -84,263,231,488.00 | ||
| White South Africa Non Market Statistics ? Evasion, Black Market, Barter & Crime | |||
| Black & Grey Markets Combined: | $50,535,421,275,136.27 | ||
| Avg Annual Criminal's Income / Savings: ? | $45,250.10 | ||
| Recovered Product + Fines & Fees: | $3,032,125,276,508.18 | ||
| Black Market & Non Monetary Trade: | |||
| Guns & Weapons: | $1,624,612,723,153.08 | ||
| Drugs and Pharmaceuticals: | $2,166,150,297,537.44 | ||
| Extortion & Blackmail: | $4,467,684,988,670.97 | ||
| Counterfeit Goods: | $4,061,531,807,882.70 | ||
| Trafficking & Intl Sales: | $812,306,361,576.54 | ||
| Theft & Disappearance: | $1,624,612,723,153.08 | ||
| Counterfeit Currency & Instruments : | $4,196,916,201,478.79 | ||
| Illegal Mining, Logging, and Hunting : | $812,306,361,576.54 | ||
| Basic Necessitites : | $3,316,917,643,104.21 | ||
| School Loan Fraud : | $2,166,150,297,537.44 | ||
| Tax Evasion + Barter Trade : | $21,730,231,148,308.60 | ||
| White South Africa Total Market Statistics ? | |||
| National Currency: | Rand | ||
| Exchange Rates: | 1 Rand = $1.06 | ||
| $1 = 0.94 Rands | |||
| Regional Exchange Rates | |||
| Gross Domestic Product: | $13,404,200,000,000.00 - 21% | ||
| Black & Grey Markets Combined: | $50,535,421,275,136.27 - 79% | ||
| Real Total Economy: | $63,939,621,275,136.27 | ||
| Anglosphere Economic Statistics & Links | |||
| Gross Regional Product: | $122,743,093,723,136 | ||
| Region Wide Imports: | $16,174,165,262,336 | ||
| Largest Regional GDP: | White Rhodesia | ||
| Largest Regional Importer: | White Rhodesia | ||
| Regional Search Functions: | All Anglosphere Nations. | ||
| Regional Nations by GDP | Regional Trading Leaders | |||
| Regional Exchange Rates | WA Members | |||
| Returns to standard Version: | FAQ | About | About | 483,893,648 uses since September 1, 2011. | |
Version 3.69 HTML4. V 0.7 is HTML1. |
Like our Calculator? Tell your friends for us... |